 |
Search |
|
|
 |
Search |
|
|
|
Here is an example of using Andy Schroder's Solar Collector Power Output simulation.
I'll use the example of my
solar
heating system here in Bozeman. Its a "homemade" system that
utilizes
|
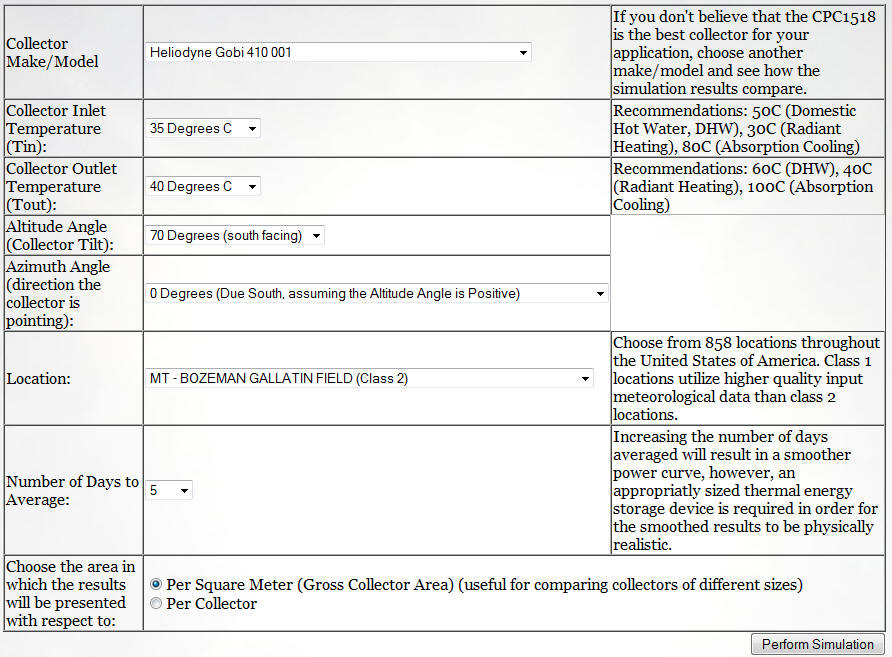
This is how I filled in the inputs for the simulation:

The logic for using these inputs:
Collector model:
Andy offers several flat plate and evacuated tube collectors.
The Heliodyne Gobi 410 is probably the closest to my collectors.
If you are making flat plate collectors, the Gobi 410 is probably the best one to choose. For carefully homemade double glazed collectors, the performance will be close. For single glazed collectors in cold climates the performance will be somewhat less than the Gobi, but probably not enough to worry about in the grand scheme of things.
Collector Inlet Temperature:
This is basically the temperature that your storage tank will average during the collection period. I think that the recommendation of 30C (86F) for radiant heating is perhaps a bit low as an average tank temperature.
I used 35C (95F) for my system. The lower this temperature, the more efficient the collector will be, so systems should be designed to keep this temperature as low as possible.Collector Outlet Temperature:
I used 40C for the collector outlet temperature.
The collector outlet temperature should be about 5C (10F) above the Collector Inlet Temperature. If its actually much more than than, then the collector flow rate should probably be increased.
Collector Tilt:
My collector tilt is +70 degrees.
This is the angle that the collector is tilted up from horizontal (so, 0 is horizontal, and 90 is vertical). If you are in the northern hemisphere, pick the positive angle for your collector tilt.
Steep tilt angles are best for solar space heating systems.
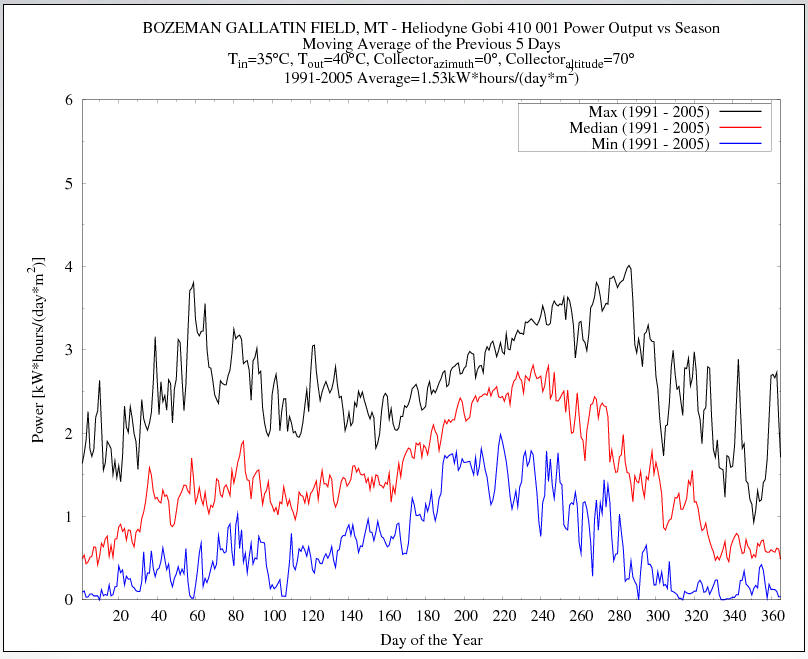
Running the simulation, this is the output I get.

For each day, the plot shows the system output in KWH per sq meter of collector area. The output covers the period of 1991 through 2005, and the output is shown for the best year, worst year, and median year.
So, for example, lets say I want to calculate the collector output, and the fuel and CO2 saving for March.
Solar Heat Energy Produced:
March is about day day 60 to day 90 -- looking at the plot, the median energy output appears to be about 1.6KWH per sq meter of collector. So, for the 31 days of March, the heat output in SI units is:
(1.6 KWH/day-sqm)(22.3 sqm)(31 days) = 1106 KWH for the month
To get the output in US units, make use of the fact that 1 KWH equals 3412 BTU, and 1 sq meter equals 10.76 sq ft.
So, 1.6 KWH/sqm is equivalent to (1.6 KWH/sqm)*(3412 BTU/KWH)(1 sqm/10.76 sqft) = 507 BTU/sqft per day.
The monthly total is then:
(507 BTU/sqft-day)(240 sqft)(31 days) = 3.77 million BTU for the month.
Fuel Saved:
We use propane fuel, and our furnace is a 90% efficient condensing furnace. Just as an estimate, I'd say the overall efficiency of our heating system with duct losses etc. might be 70 or 80% -- I'll use 75%.
So, the propane saving is:
(3,770,000 BTU) / ( (92,000 BTU/gal)(0.75efic) ) = 54.7 gallons of propane saved for March
We pay about $2.20 for the propane, so that's $120 saving for March.
If our heat was electricity, at 95% efficiency, then our savings would be:
(1106 KWH) / (0.95 efic) = 1164 KWH per month
At our rate of about 11 cents a KWH, the dollar saving would $128 for March.
Green House gas reduction:
Propane CO2 emissions are about 13 lbs per gallon of propane burned, so for the 54.7 gallons of propane saved, the CO2 reduction is about (13 lb/gal)(54.7 gal) = 711 lbs of CO2
If we heated with electricity, the average CO2 emissions in the US per KWH is about 1.5 lbs, so for 1106 KWH used in March, the CO2 reduction would be about (1106 KWH)(1.5 lbs CO2/KWH) = 1659 lbs of CO2.
If you are going to do a lot of these calculations, or you want to know how the solar heat produced by a given set of collectors compares with the heat demand for your house, then you probably want to use the method shown on this page to do the estimate.
Gary April 30, 2010